

Stocks have delivered the higher return in one long-run comparison, but that doesn’t settle the question for UAE investors. From 1983 to 2023, real estate returned 5.4% per year, compared with 8% for the S&P 500; UAE property recorded a nominal annualized return of 7.04% from Q1 2004 to Q1 2024, before inflation. These different periods and markets make the UAE real estate vs stock market returns comparison more nuanced than a single ranking.
Property can provide rental income and direct ownership, while stocks and REITs offer different ways to access markets and earn income. Each carries distinct risks, from property expenses and resale timelines to market volatility. The balance between income and capital growth depends on the asset and how long you hold it.
This article compares UAE property, REITs and stocks by returns, income, timelines and risks. You’ll learn how gross rental yield differs from income after costs, why past performance can hide periods of decline, and what to consider when making a disciplined investment decision.
Key Takeaways
- Compare total returns, not headline yields: distinguish rent or dividends from capital appreciation and subtract the costs that affect what you retain.
- Choose between direct property, REITs and stocks by weighing ownership, income access, liquidity and the level of involvement you want.
- Assess the investment timeline carefully. Property resale and market recovery can take time, while listed assets can be easier to trade but may fluctuate sharply.
- Stress-test property assumptions for lower rent, higher expenses and flat or falling values before committing capital.
- Use the decision guide to align your choice with income needs, risk tolerance and investment horizon, then consider whether a curated ready or off-plan property fits your strategy.
Stocks vs Real Estate in Dubai: Which Offers Better Returns?
There is no single winner: returns vary by period, market and the income included in the comparison. UAE property combines rent with potential appreciation, while stocks can deliver dividends and price growth.
Foreign investors’ property ownership depends on location-specific eligibility and title rules; listed shares are acquired through a securities account and represent ownership in the issuing company. For an investment property, the typical down payment is 40% of the purchase price, and mortgage registration is 0.25% of the loan amount.
Dividends, Rent, and Property Appreciation
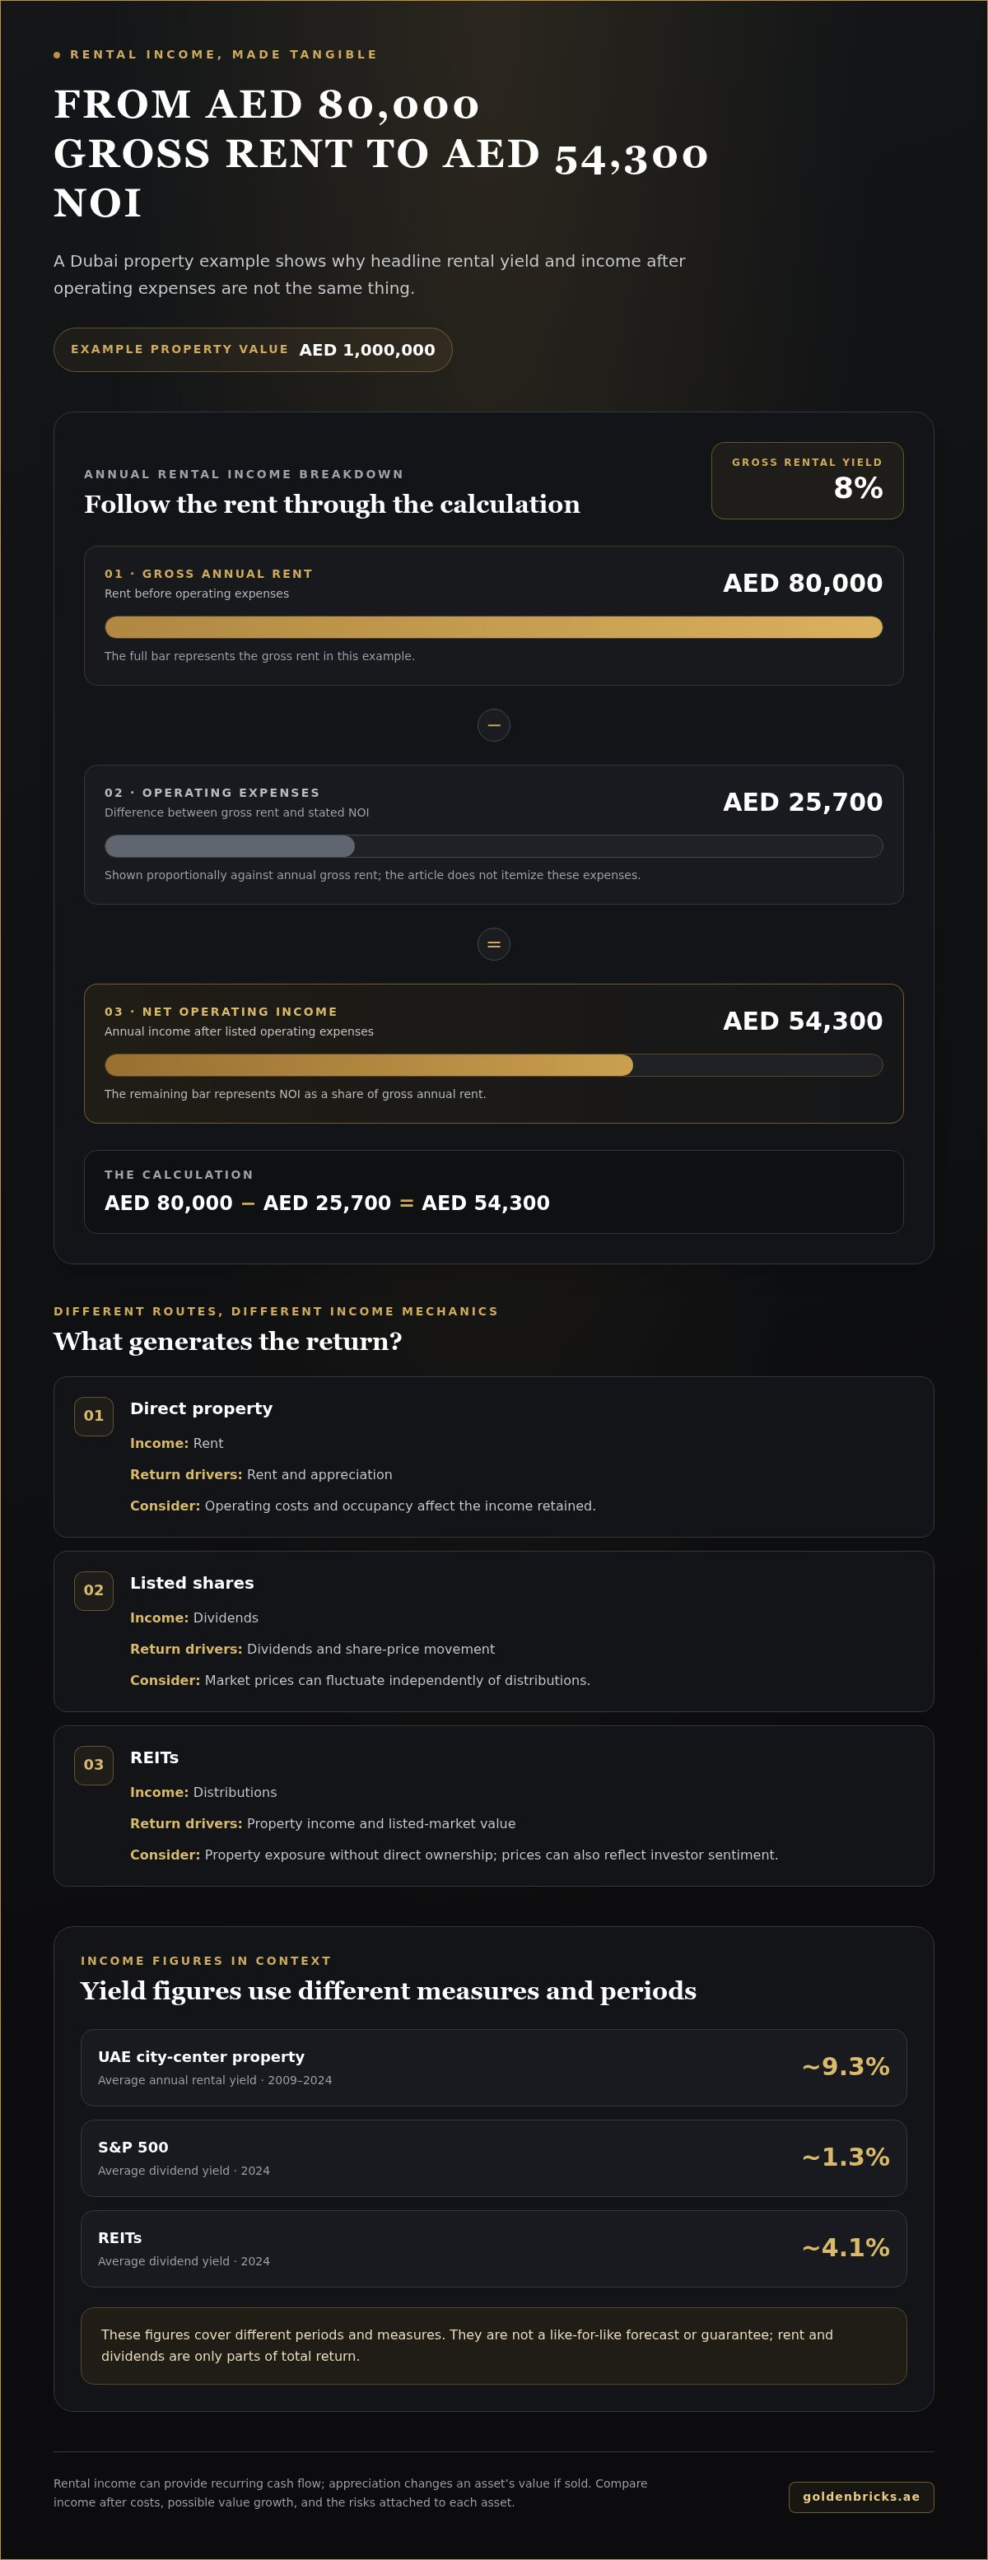
Dividends and rent provide income, while appreciation increases an asset’s value if sold. The average S&P 500 dividend yield was about 1.3% in 2024; UAE city-center properties averaged about 9.3% annual rental yield from 2009 to 2024. These figures cover different periods and measures, so they aren’t a like-for-like forecast or guarantee.
For longer comparisons, real estate returned 5.4% per year from 1983 to 2023, while the S&P 500 returned 8% per year over that period. UAE property’s nominal annualized return was 7.04% from Q1 2004 to Q1 2024, before inflation. Market sentiment, location and demand influence appreciation, while dividends and rent depend on income generated by the underlying asset.
Rental Income and Investment Trade-Offs
Rental income can provide recurring cash flow, but gross yield isn’t the amount an owner retains. In an illustrative Dubai example, a د.إ1,000,000 property earning د.إ80,000 in annual rent has an 8% gross yield. After listed operating expenses, its net operating income is د.إ54,300 annually.
That distinction matters when comparing rent with dividends. Landlords need to account for operating costs and occupancy, while shareholders depend on distributions and face share prices that can move independently. Rental income and appreciation also suit different strategies: one prioritizes cash flow, the other aims for value growth over time.
| Option | Income source | Return driver | Key consideration |
|---|---|---|---|
| Direct property | Rent | Rent and appreciation | Operating costs affect net income |
| Listed shares | Dividends | Dividends and share-price movement | Market prices can fluctuate |
| REITs | Distributions | Property income and listed-market value | Exposure without direct ownership |
Choose based on whether you prioritize direct ownership and rental income or more readily traded exposure through listed assets.
Listed REITs compared with direct and fractional property investment
Listed REITs provide property exposure through shares, without requiring direct ownership of an apartment. Direct ownership gives investors control over a specific asset, while fractional investment divides exposure among participants. The right route depends on liquidity needs, desired involvement, diversification and how property values fit into a wider portfolio.
Listed REIT shares can generally be bought or sold through the market, though liquidity may vary. Their prices may change with both property income and investor sentiment. The average REIT dividend yield was around 4.1% in 2024, while the UAE REIT industry was expected to have earnings decline by 4.8% per year over the next few years. These figures show why distributions and share-price movements should be assessed separately.
Direct investment ties returns to one property’s rent, operating costs and resale value. Fractional ownership can spread exposure across property interests, but investors have less direct control over the underlying asset. Neither route automatically provides diversification: a portfolio concentrated in one building, area or property type remains exposed to its specific values and demand drivers.
Dubai activity provides market context, not a return forecast. The city recorded 80,509 residential property sales worth AED 226.5 billion in H1 2026. In Q1 2026, total real estate transaction value reached AED 252 billion, including AED 173 billion in real estate investment value. Transaction volume signals market activity; it doesn’t establish future appreciation or rental performance.
Ready properties can begin generating rental income after acquisition and leasing, subject to occupancy and expenses. With off-plan property, investors buy before completion, so rental income generally depends on delivery and subsequent leasing. Compare cash-flow timing, project progress, location, expected tenant demand and resale options, rather than purchase price alone.
Test downside before choosing either route. For Dubai property, model a resale price 10% below purchase cost and assess whether the investment can withstand three years without capital appreciation. For listed REIT shares, consider how falling earnings or weaker sentiment could affect distributions and market value. Liquidity may make exchange-traded shares easier to sell, but it doesn’t prevent losses or guarantee a favourable sale price.
Investors assessing ready property can use Dubai property market intelligence to compare location, asset characteristics and investment objectives. This analysis helps clarify whether direct ownership aligns with the portfolio, or whether listed shares better suit the desired liquidity and level of involvement.
Differences in the drivers and timelines of property and stock returns
Property and stocks differ in how returns are generated and when investors can realize them. Rent, occupancy and resale demand shape property outcomes; company earnings, dividends and market sentiment influence listed assets. A portfolio holding both can combine rental income with exposure to publicly traded businesses, although neither asset class follows a predictable timeline.
Dubai’s rental market provides a measure of activity: rental-contract values reached AED 32.2 billion in Q1 2026. That figure reflects contract value, not an individual investor’s net income. Property cash flow depends on rent collected, vacancy, service charges, maintenance and management. Stock returns, by contrast, may come from dividends and share-price changes, which can be realized through market transactions.
Upfront property costs affect capital available for other investments. The typical down payment for a UAE investment property is 40% of its purchase price, and mortgage registration is 0.25% of the loan amount. Investors should also account for transfer fees, agency fees and financing costs. These, together with service charges, maintenance and management, reduce the amount retained from rental income.
Ongoing costs vary by property and operating arrangements. Maintenance typically costs 1% of a property’s value yearly, while management fees are usually 8% to 12% of rental income. These costs should be entered into a cash-flow forecast before comparing a property’s net income with stock dividends.
Consider the timeline as well as the headline return. A property may take time to complete, lease or sell, while exchange-traded shares can generally be bought and sold through market trading. That liquidity does not remove price risk. For direct property, transaction timing, buyer demand and condition can affect resale proceeds and how long an exit takes.
To compare options, estimate property income after operating costs, then assess stocks through both dividends and potential price movements. Finally, consider how each allocation affects liquidity and portfolio concentration. This step-by-step comparison helps you judge whether the assets complement each other or one better suits your investment horizon.
Dubai property market activity compared with global equities
Dubai real estate and global equities reflect different markets, income sources and cycles. Compare them using consistent dates and return measures.
Dubai Real Estate and Equity Return Performance
From March 31, 2004, to March 28, 2024, the S&P 500 annualized return was 8.01%. UAE property’s nominal annualized return was 7.04% from Q1 2004 to Q1 2024, before inflation. These periods are close, but not identical. Dubai property also varies by area and property type: location, tenant demand, supply and asset condition shape individual performance. Abu Dhabi has its own market drivers, so citywide or national averages cannot establish which city or property type leads.
Inflation-Adjusted Total Returns Over Shared Periods
After inflation, the S&P 500 delivered an annual return of 7.66% from 1992 to 2024. For a valid comparison, both property and equity returns must cover the same dates, include their respective income, and be adjusted using the same inflation measure. The UAE property figure of 7.04% is nominal and covers Q1 2004 to Q1 2024, so it cannot be directly ranked against the S&P’s inflation-adjusted return.
Historical Returns of UAE Stock Indices
The DFM General Index and ADX General Index represent different mixes of listed companies, so their annual performance can diverge. To calculate an annual index return, compare its level at the start and end of the year; a total-return measure should also include distributions. A short market snapshot is not an annual return, and one year does not establish long-term equity performance.
Dubai’s property activity has been substantial: residential sales reached 80,509 in H1 2026, valued at AED 226.5 billion. In Q1 2026, total real estate transaction value was AED 252 billion, while real estate investment value reached AED 173 billion. These figures indicate transaction scale and capital flows, not a guaranteed increase in prices or rental income.
Forecasts should be treated as scenarios, not established outcomes. S&P Global Ratings analysts predicted Dubai real estate prices could drop by 10 to 15% in the next two years. That outlook highlights a key difference from equity analysis: property values can respond unevenly across neighbourhoods and property types, while broad equity indices aggregate many listed companies.
For a location-level comparison, assess Dubai and Abu Dhabi separately, then distinguish apartments from villas and other asset types. Compare rent, occupancy, transaction activity and price movement over matching periods. These measures show the economic advantages and risks of each investment more clearly than a national average. Stability depends on the asset and holding period.
Real estate and stock market risks
Investment risk affects both income and wealth, but differs across assets. A Dubai property investor faces vacancy, operating expenses, financing and resale risks. A stock investor faces price volatility, company performance and market sentiment. Weigh each investment’s downside against your ability to hold it through a weak market, rather than relying on expected returns alone.
Dubai property values have experienced prolonged declines. The UAE property market fell 36.5% between Q2 2008 and Q4 2010, taking 5.5 years to recover. After its December 2014 peak, the market fell 30.2% to its lowest point in September 2020, and recovery took 10 years, reaching the earlier level by Q1 2024. A long holding period doesn’t remove the need for cash-flow resilience.
Equities can move more quickly in both directions. The S&P 500 lost 52.6% during the 2008 financial crisis and recovered in 5.5 years. During the March 2020 COVID-19 crash, it recovered within 7–8 months. These episodes show why liquidity can help investors adjust positions, but selling during a decline can lock in losses.
Leverage adds another layer of exposure to property risk. A mortgage or off-plan payment plan can increase returns relative to cash invested, but it can also amplify losses and leave payments due when rent or resale proceeds fall short. Before a transaction, stress-test the investment using a mortgage rate 2 percentage points higher than the current rate, rent 10% below expectation, and service charges 15% above the estimate.
Operating costs also matter. In an illustrative Dubai property example, service charges of AED 18,000 against annual rent of AED 90,000 consume 20% of gross rent, before other costs. A separate illustration lists maintenance, vacancy and management or leasing costs, showing why gross yield alone cannot establish net income. Review each expense against expected rent and available reserves.
Use a concise risk analysis before committing capital:
- Model a property resale price 10% below its purchase cost.
- Test whether the investment can withstand three years without capital appreciation.
- Compare mortgage payments and recurring expenses with rental income under reduced-rent assumptions.
- For shares, assess how falling company earnings and market sentiment could affect both price and dividends.
These tests clarify whether an asset can withstand a downturn without forcing an early sale. For a property-focused assessment of Dubai market conditions, explore real estate market intelligence before making your next investment decision.
Golden Bricks Real Estate: Exclusive Off-Plan Projects
Golden Bricks Real Estate helps investors turn a return strategy into a property selection, whether they are considering an off-plan opportunity or a ready asset. Its Exclusive Off-Plan Projects and Exclusive Ready Properties suit different investment timelines: off-plan purchases involve waiting for completion, while ready properties may suit investors assessing immediate rental potential.
Project Curation helps align property selection with investment priorities, while Property Management supports owners focused on rental income and ongoing operations. These services are relevant when direct UAE property ownership fits your objectives, available capital and tolerance for property-specific risks. They complement, rather than replace, the broader portfolio analysis needed to compare real estate with listed investments.
Contact Golden Bricks Real Estate to discuss your property investment objectives.
Shape Your Next Investment Decision
Start by defining the role you want property to play in your portfolio. Set your priorities: recurring income, long-term value growth, direct ownership or greater flexibility to adjust your holdings. Then compare each opportunity with your liquidity needs, investment horizon and capacity to manage property-specific decisions. This turns the UAE real estate vs stock market returns comparison into a practical allocation choice, not a contest between headline figures.
If property is part of your strategy, Golden Bricks Real Estate offers Exclusive Off-Plan Projects, Exclusive Ready Properties and Property Management. These options cover different ownership stages, from selecting a prospective asset to managing an income-producing property. Consider which route fits your objectives and the level of involvement you want.
Contact Golden Bricks Real Estate to discuss your property investment objectives. A considered next step can help you move from market analysis to a strategy aligned with your wider financial plan.
Frequently Asked Questions
What about REITs?
REITs provide property exposure through shares rather than ownership of a specific home or building. Their listed prices can make buying and selling more accessible than a direct property transaction, and a fund may hold multiple assets. Before investing, review the REIT’s property types, geographic concentration, debt, distribution history and trading activity. A REIT can add property exposure, but its share price remains subject to market movements.
Why did real estate perform well when stocks fell in 2025?
The comparison depends on the stock index, property measure and dates selected. A period of stronger property performance can reflect rental demand and slower valuation changes, while listed shares reprice continuously as earnings expectations and sentiment shift. Compare like with like: use total returns, align start and end dates, and account for property expenses and dividends. An index’s price change alone does not measure an investor’s full return.
Does real estate still matter now that the 60/40 portfolio has changed?
Yes, property can remain a distinct portfolio asset even as the traditional 60/40 approach evolves. That convention refers to stocks and bonds, not a fixed allocation that suits every investor. Direct real estate, REITs and equities differ in liquidity, income sources and management demands. Assess how property exposure complements existing holdings, whether it adds concentration, and whether you can retain it through slower sales or changing rental conditions.
Is Dubai Property Still a Good Investment in 2026?
Assess a property investment against your income needs, holding period and ability to manage its costs. A sound decision starts with a specific asset, not a citywide headline: evaluate location demand, expected occupancy, service charges, maintenance and likely resale conditions. Compare net cash flow with other investments and test a weaker rent or resale scenario. The investment’s merits depend on whether its economics fit your plan.
ROI Comparison: Which Gives Better Returns?
Neither property nor stocks consistently lead across every period and measure. Comparing UAE real estate vs stock market returns requires matching dates and total-return measures, including rent after property expenses and dividends alongside changes in asset value. Then account for purchase and sale costs, financing and capital committed. This is more useful than comparing gross rental yield with an index’s price movement alone, especially when leverage changes your exposure.
Risk Analysis: Which Investment Is Safer in 2026?
Neither investment is inherently safer; their risks differ. Property can concentrate capital in one asset and take time to sell, while listed shares can fall sharply and fluctuate day to day. For a practical comparison, consider how much income you need, how quickly you may need access to capital, and whether a fall in value could force a sale. Diversifying across holdings can reduce reliance on one asset or company.
So what should I do?
Start by defining what each investment should do: provide current income, support long-term growth or preserve access to capital. Set your investment horizon and liquidity needs, then compare shortlisted assets by net income, purchase and exit costs, and downside scenarios. For property, assess the specific building and tenant demand; for shares, examine company exposure and dividend policy. Choose an allocation you can maintain through market volatility.
What are the average annual returns on UAE residential real estate over the past 5, 10, and 20 years?
A UAE property market comparison recorded a nominal annualized return of 7.04% from Q1 2004 to Q1 2024, a 20-year period. Five-year and 10-year averages depend on the exact start and end dates, the residential index used, and whether rental income is included. For a meaningful comparison, calculate each period using the same index methodology and distinguish price appreciation from total return after ownership costs.