
Dubai’s off-plan commercial market is growing sharply: it recorded 3,123 sales in H1 2026, up from 1,239 in H1 2025, while transaction value rose from approximately AED 3.0 billion to AED 17.0 billion. This momentum places off-plan activity at the centre of the UAE commercial real estate outlook for 2026, while sales volume and value provide a fuller measure of market direction.
Rising off-plan figures signal stronger activity, but they are only part of the picture. The balance between completed and off-plan sales, changing transaction values and Dubai’s share of the wider UAE market all help investors assess the depth and character of that growth.
This outlook examines the evidence behind the trend, including Dubai’s commercial sales and transaction values in H1 2026, how the emirate compares within the UAE market, and what the activity suggests for offices, retail and other commercial assets. The aim is a measured view of where momentum is building and which indicators merit closer attention when evaluating opportunities.
Key Takeaways
- Assess off-plan momentum alongside completed sales to distinguish rising activity from shifts in transaction value.
- Compare office, retail and logistics indicators to identify which commercial segments are shaping demand.
- Use Dubai’s share of UAE market activity to put local transaction trends in a wider national context.
- Read sales volumes and values together for a more considered view of market direction and investment opportunities.
Is off-plan commercial property growing in Dubai?
Yes. Dubai’s off-plan commercial activity is expanding, alongside strong demand for completed offices and retail assets. In H1 2026, commercial property transactions increased 7.2% year on year, while Dubai recorded 163,356 commercial rental transactions. These indicators point to active occupier demand as well as investment activity.
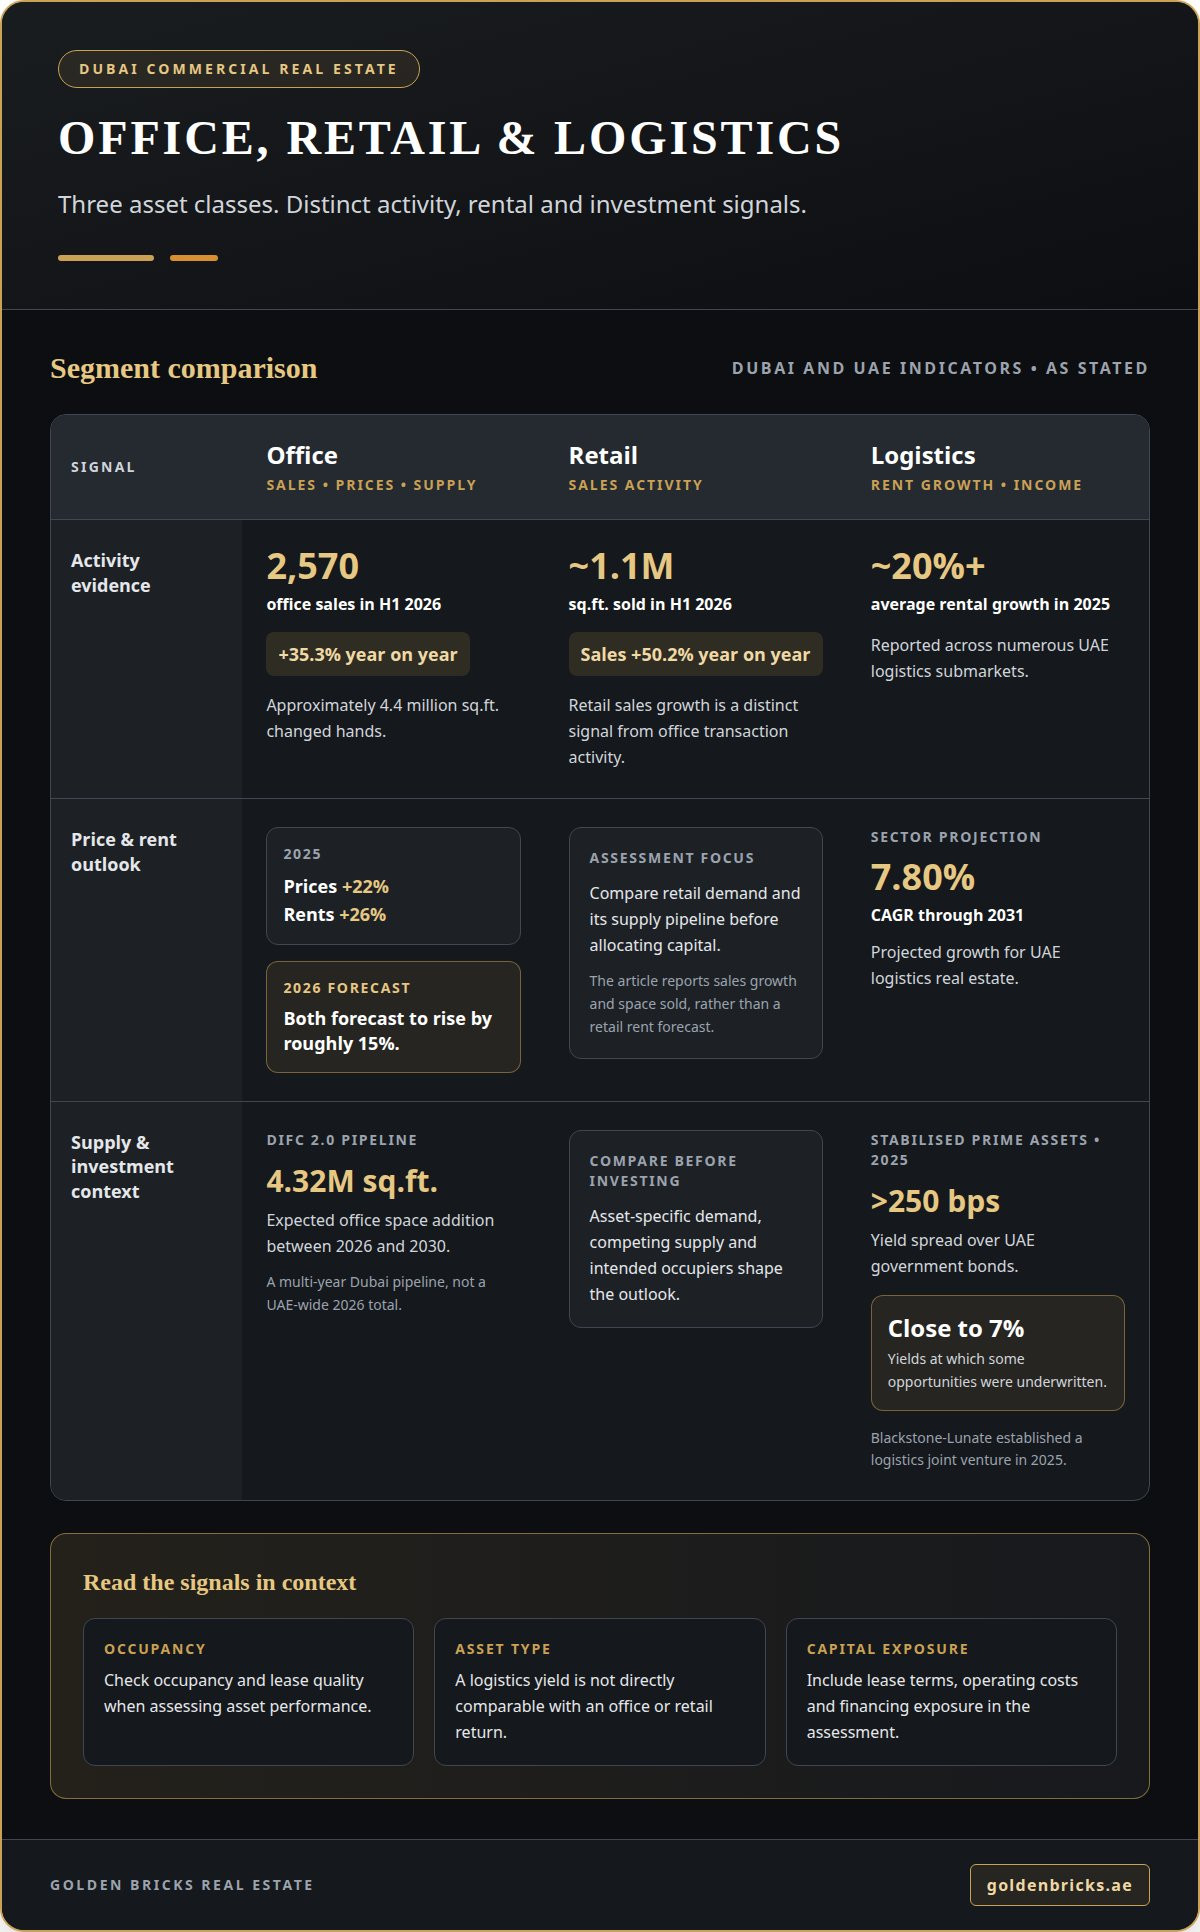
Office sales provide another measure of capital movement. Dubai recorded 2,570 office sales in H1 2026, up 35.3% year on year, with approximately 4.4 million sq.ft. changing hands. Office prices rose 22% and rents grew 26% year on year in 2025; both are forecast to increase by roughly 15% in 2026.
Dubai and Abu Dhabi offer the strongest demand signals. In Dubai, DIFC and free-zone locations benefit from corporate arrivals; Abu Dhabi’s prime business districts show tight office occupancy. For supply, DIFC 2.0 is expected to add 4.32 million sqft of office space between 2026 and 2030, a multi-year Dubai pipeline rather than a UAE-wide 2026 total.
Retail and logistics add distinct investment signals. Dubai sold approximately 1.1 million sq.ft. of retail space in H1 2026, while retail sales rose 50.2% year on year. Across numerous UAE logistics submarkets, rental growth averaged approximately 20% or more in 2025; logistics real estate is projected to grow at a 7.80% CAGR through 2031. Corporate expansion, occupier demand and asset-specific rental performance shape investment returns, so compare each segment’s demand drivers and supply pipeline before allocating capital.
What does the H1 2026 Dubai Commercial Real Estate Market Report cover?
A useful H1 2026 investment review examines where institutional capital is flowing and which assets attract it. Data centres, logistics facilities and specialised offices are identified as leading commercial real estate investment targets. This mix reflects demand for digital infrastructure, efficient supply chains and workplaces aligned with business requirements across the regional real estate market.
Logistics offers a specific yield signal. In 2025, stabilised prime logistics assets in the UAE had a yield spread exceeding 250 basis points over UAE government bonds. Investors were willing to underwrite some opportunities at yields close to 7%. Blackstone-Lunate also established a logistics joint venture in 2025, illustrating institutional interest in the sector. Rental growth and income stability remain central to assessing each asset.
Investor positioning is increasingly selective as early-mover advantages diminish. Compare occupancy, lease quality, asset specialisation and financing exposure before committing capital. For sponsors and developers managing complex funding structures, international property finance specialists such as thefederalgroup.com support projects through tailored development finance and private equity. Digital infrastructure, selective offices and alternative assets can attract investment, but sector fundamentals differ. Dubai Economic Agenda D33 is a 10-year roadmap designed to double Dubai’s GDP by 2033, placing long-term growth and infrastructure priorities in the strategic context.
Yield comparisons across Dubai, Abu Dhabi and Sharjah should account for asset type, occupancy, lease terms and operating costs. A logistics yield is not directly comparable with an office or retail return. For 2026, assess the applicable rules, taxes and fees by emirate, property and ownership structure, then include acquisition and operating costs in net-return calculations.
Prices and rents also face financing and macroeconomic risks. Global volatility, policy uncertainty and elevated interest rates can temper recovery; loan maturities and rising borrowing costs add refinancing pressure. Investors can use commercial real estate market intelligence to assess asset selection against these capital and sector considerations.
Dubai market share and transaction activity
Dubai is a major part of the UAE real estate market, but market share alone does not establish commercial demand. The emirate recorded 215,671 property transactions, valued at AED 686.6 billion, during that year. Compared with 181,689 transactions worth AED 523.5 billion in 2024, both activity and aggregate value increased. These broad figures include residential and commercial assets, so investors should separate asset classes before drawing conclusions about commercial demand.
Commercial market-share data adds useful context. Dubai captured 55% of the UAE commercial real estate market in 2025, while offices represented 41% of that market. Rental transactions accounted for 67%, indicating that leasing activity forms a substantial part of commercial market activity. Compare rental and sales indicators together: leasing can reflect occupier requirements, while sales reveal asset transfers and capital allocation. Retail and office performance can differ, even within the same emirate.
Abu Dhabi’s residential activity shows the scale of competition between the UAE’s two largest property markets. The emirate recorded approximately 7,800 residential deals in Q1 2026, following a 47.43% year-on-year increase in residential sales transactions during 2025. Abu Dhabi represented 27.6% of the UAE real estate market in 2025. These figures describe residential activity, not commercial transactions, but they help frame the wider expansion of regional property investment.
Developer activity also shapes future choice and supply. Abu Dhabi announced 22 new projects in Q1 2026, including nine branded residential developments. For commercial investors, project announcements matter most when they add comparable space near established business districts or transport links. Assess the location, intended occupier and competing pipeline rather than treating launches as proof of immediate demand. In Dubai, strong commercial market share and substantial transaction activity make asset-level analysis essential: distinguish leasing momentum from completed sales, then compare each property’s use and location.
Commercial property sales and transaction values
Dubai recorded 6,470 commercial property sales worth AED 62.2 billion in H1 2026. Sales value increased 6.1% year on year, indicating higher aggregate capital deployed through completed transactions. The distinction matters: sales volume measures deal count, while total value reflects the size and pricing mix of assets changing hands. Read both together before interpreting market momentum.
Transaction values grew 28.3% year on year, another signal of active investor interest. Large individual deals can influence aggregate figures, so they should be considered alongside broader sales activity. These examples show how one major asset can shape value trends without representing the whole market.
Retail activity also contributes to Dubai’s commercial sales picture. Deal counts and unit pricing together help distinguish broad market participation from value concentrated in larger assets. Compare like with like, taking account of asset class, size and location before interpreting transaction values across offices, retail and logistics.
The clearest takeaway is to assess value growth alongside deal volume, sector mix and notable transactions. These measures provide a more disciplined view of economic demand than any single headline figure. For support with the ongoing oversight of commercial assets, discuss commercial property management.
Golden Bricks Real Estate: Exclusive Off-Plan Projects
Golden Bricks Real Estate offers Exclusive Off-Plan Projects for investors assessing future commercial opportunities, alongside Exclusive Ready Properties for those seeking completed assets. Its Project Curation supports considered project selection, while Property Management helps owners oversee assets after acquisition.
These services are useful when market activity needs to inform a property decision: compare off-plan and ready opportunities, identify assets that fit your investment objectives, or plan for ongoing ownership. Project selection can take account of location, intended use and demand indicators, while property management supports the work that continues after a transaction.
For a considered next step in evaluating commercial property opportunities, contact Golden Bricks Real Estate or visit goldenbricks.ae.
Turn market signals into a considered property strategy
The UAE commercial real estate outlook 2026 is most valuable when it informs a clear investment mandate, not a reaction to headline momentum. Before selecting an asset, define its intended role in your portfolio: income generation, long-term ownership, or a strategic position in a particular commercial segment. Then assess how location, occupier profile and ongoing management requirements align with that objective.
A disciplined next step is to compare opportunities using consistent criteria. Consider whether the asset’s use fits your strategy, what oversight it requires and whether its characteristics suit your ownership horizon. This framework helps focus decisions across off-plan and ready properties without treating every market signal as a reason to act.
For a measured discussion of your commercial property objectives and potential next steps, connect with Golden Bricks Real Estate. A considered strategy begins with the right questions and a clear view of what you want the asset to contribute.
Frequently Asked Questions
What is happening in Dubai’s office property market?
Dubai’s office market is seeing active investor and occupier interest, with corporate migration supporting demand for quality workspace. For occupiers and international businesses managing regional expansion, corporate advisory partners like Resolute Global help align commercial property choices with operational goals. For investors, distinguish between buying an office asset and leasing space for business use, since each involves different considerations. Compare building specifications, tenant profiles, lease structures and locations, then assess whether the expected income or business use aligns with your objectives.
What is the UAE commercial real estate market outlook for 2026?
The outlook points to continued market expansion, with outcomes varying by asset class and location. The UAE commercial real estate market is forecast to grow at 6.33% from 2026 to 2031. For investment decisions, assess this national trend alongside local occupier demand, new supply and asset quality. The UAE commercial real estate outlook 2026 is therefore best viewed through segment-specific analysis, rather than a single market-wide signal.
What are the 2026 office rental prices and vacancy rates in Dubai and Abu Dhabi?
How are UAE commercial property sales prices and transaction volumes forecast to change in 2026?
Transaction volumes and sale prices can follow different patterns across commercial asset classes. Deal counts show how frequently assets change hands; prices reflect factors such as location, condition, tenant demand and competing supply. To evaluate a forecast, compare like-for-like properties and separate offices, retail and industrial assets. This helps distinguish broad market movement from shifts concentrated in particular property types.
What is the outlook for UAE retail, warehouse, logistics, and industrial property in 2026?
How do commercial real estate investment yields compare across Dubai, Abu Dhabi, and Sharjah in 2026?
The material gives no yield ranking across Dubai, Abu Dhabi and Sharjah. Compare yields by asset type, occupancy, lease terms and operating costs; some UAE prime logistics opportunities were underwritten at yields close to 7% in 2025.